Are you currently using bookmarks in your PowerBI reports? You should be.
The Power BI bookmark feature (released in the summer update) allows users to highlight certain views and filters of a report to tell a story.
Table of Contents
The Microsoft Power BI bookmark feature was released with the summer update of Power BI desktop and allows users to highlight certain visuals and filters of a report to tell a story.
One way to think about Power BI bookmarks is as if they were the next slide of a PowerPoint presentation. You can have the viewer see the data one way and then with one click, change a multitude of filters to display your next story point in your report.
The other way to think about the Power BI bookmark feature, which I think is much more powerful, is to use each bookmark as a button to a new view or topic in your report. This makes your Power BI report feel much more like an application rather than just a simple report. You can have images or words linked to different bookmarks, then each bookmark be a tab in your report. We used this method in our pre-built Power BI dashboards for Microsoft Dynamics GP.
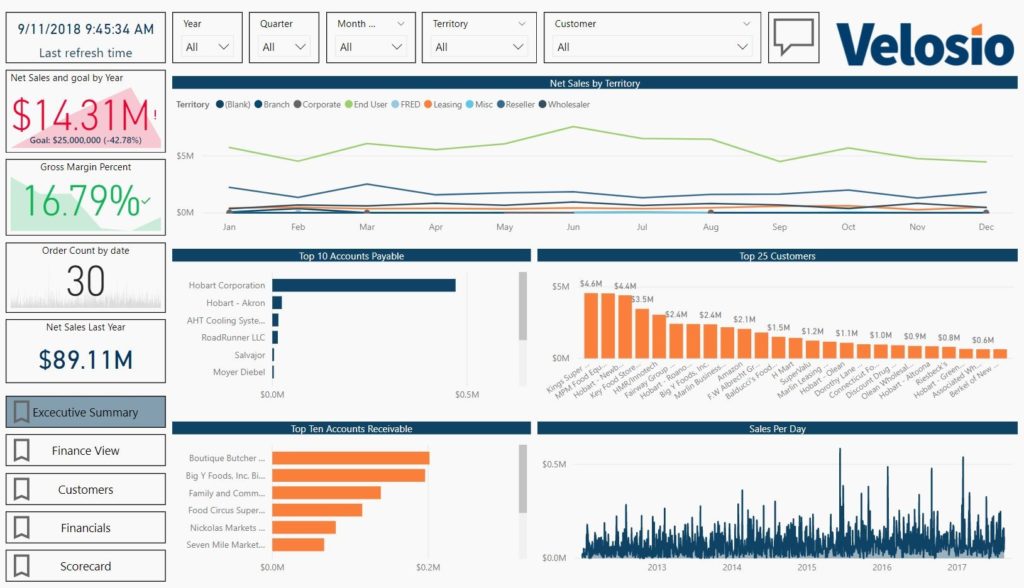
In the bottom left corner of the example above, we are using five different bookmarks—allowing the user jump to different tabs in the Power BI report. This design is ideal for end users that are newer to Power BI.
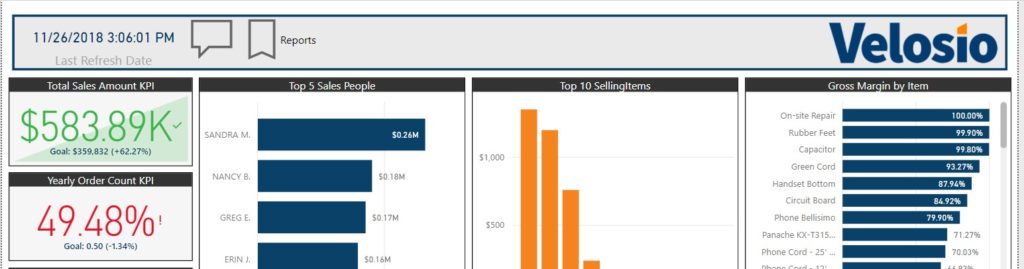
Most end users are relatively comfortable using a website, and for the most part websites have a standard menu bar or main navigation on the top or side of the screen with content and information in the middle. We can mimic this type of layout using buttons as menu bars one of two ways: using the method shown above or by using a “Menu” that comes in and out as shown below. In the images below, the “button” labeled ‘reports’ opens the menu you see in the second image.
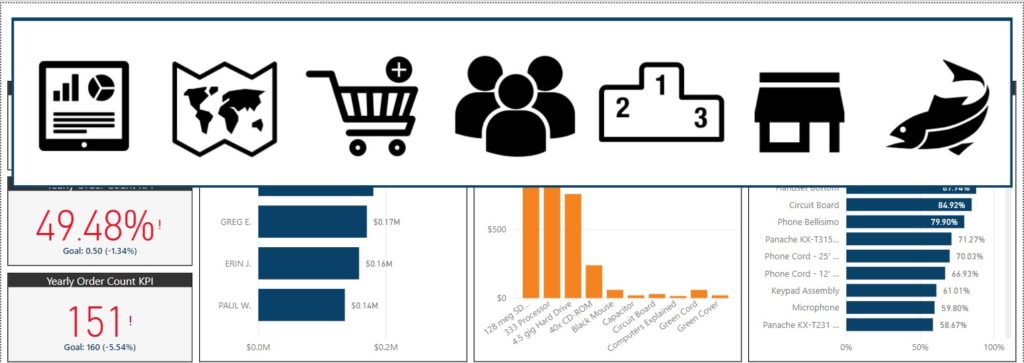
By clicking on one of the icons (that is linked to a specific bookmark), you can take the end user to a specific tab in the report. The users experience is similar to that of a web application.
Pair this with our pre-built Microsoft GP dashboards and you can automate your entire reporting process end-to-end. Just make the connection to your data set, publish your reports, then consume and share your reports on powerbi.com, in PowerPoint, or both!
Talk to us about how Velosio can help you realize business value faster with end-to-end solutions and cloud services.