Four Ways to Use Bookmarks in Microsoft Power BI
Bookmarks in Microsoft Power BI allow users to capture the current view of a report page, including the state of slicers and visuals.
Table of Contents
When reading a book, we often bookmark sections or pages that we want to return to later. In Microsoft Power BI, you can bookmark specific views of pages much like in a book. Bookmarks in Power BI allow users to capture the current view of a report page, including the state of slicers and visuals. The most common use for bookmarks is to capture the current state of a report to review later, however, there are many other ways bookmarks can be used. In this article, you will see four ways that bookmarks can be used to upgrade your Power BI pages into a fully functioning report.
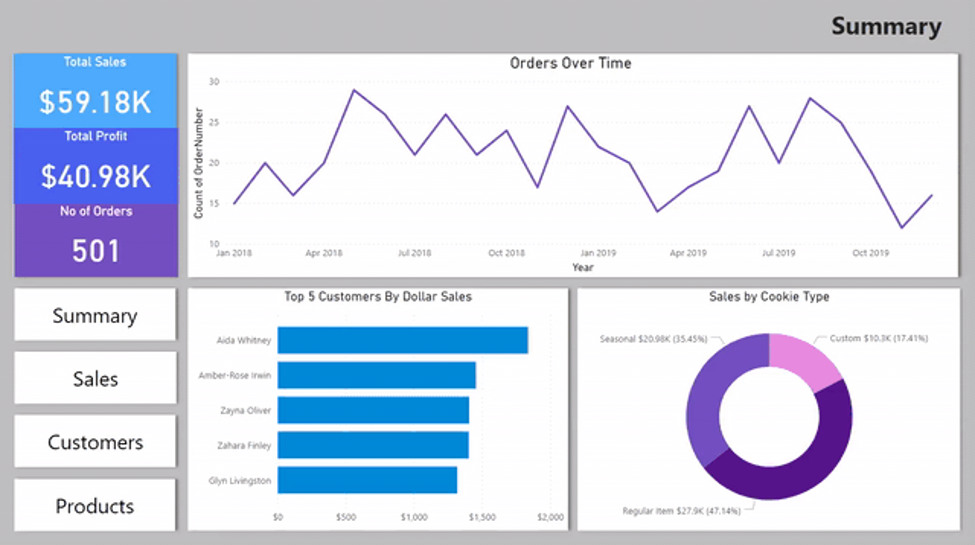
Card visuals can be useful when displaying KPIs on a report page, however, they are not very interactive to the user. By creating bookmarks and linking them to buttons, you can turn these KPIs into actionable card visuals. In this example, we can click on each card visual to show different performance measures over time. This allows the user to have more real estate on the page and interact with card visuals.
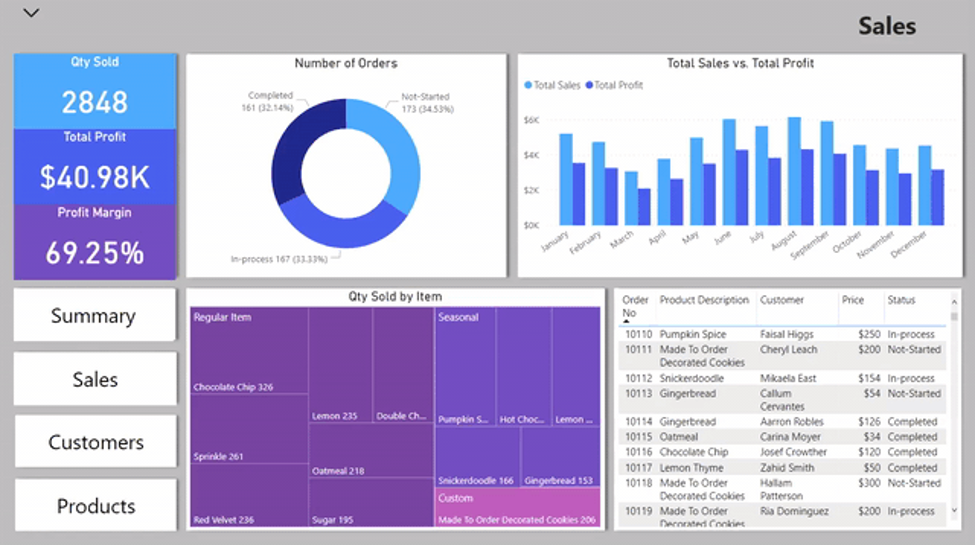
You can make your page transitions smooth and seamless with page navigation buttons. By linking bookmarks for each report page to navigation buttons, a user can transition to different pages of the report without having to continually use the ribbon at the bottom of the screen. This feature is beneficial to users because it turns report pages into a fully functioning system.
Filters can take up a lot of space on a report page, which can make the report cluttered and difficult to read. A filter pane makes it easy to use multiple filters without sacrificing the overall look of your report. A pane like this could be useful for other visuals as well, such as page navigation buttons.
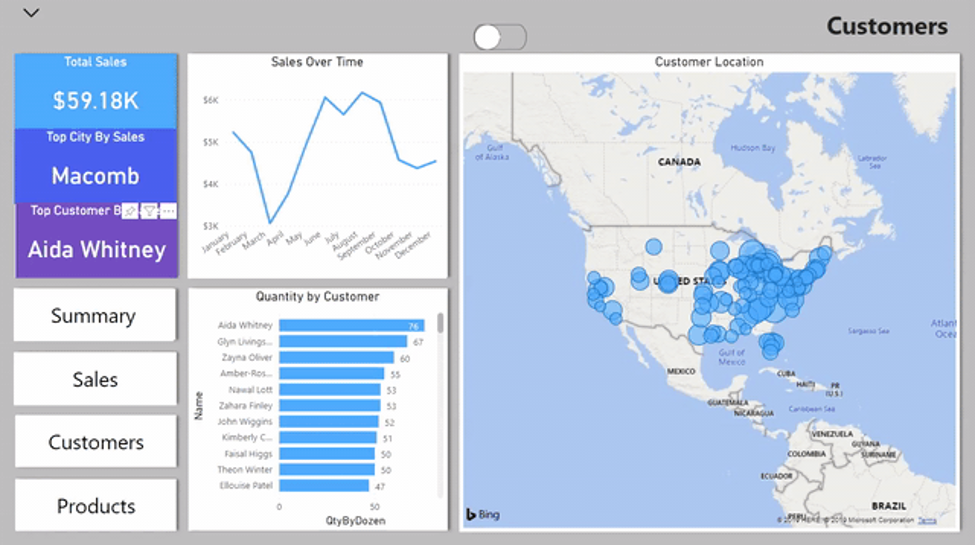
A toggle button is another way to limit the amount of real estate that is used in a report, because it allows you to easily switch between two visuals on a page. In the example below, we can switch between two different views of location data; a map view and a data view. A toggle button will allow your viewers to choose how they want to view their data.
These bookmark tricks will enable you to give your users a fully navigable report that is easy to use and visually appealing. .
Talk to us about how Velosio can help you realize business value faster with end-to-end solutions and cloud services.