Choosing the Right Metrics
Choosing the right metrics to measure is the difference between success and failure but how do you pick the right metrics without overloading yourself with info?
Choosing the right metrics to measure is the difference between success and failure but how do you pick the right metrics without overloading yourself with info?
Table of Content
The sky is the limit – how to bring metrics back down to earth.
Terms:
Microsoft Dynamics CRM can track and report on anything, using out-of-the-box functionality.
But how do you figure out what is most relevant for your business? What information will be useful? Will you have staff enter the data for reporting? What are you already doing right and what are areas of opportunity? How do you figure out what is most relevant for your business? The more of these questions you can answer the better your performance will in the future.


Take the analysis methods you’re using now, and turn them into a metric. Look at the various ways CRM impacts your business, and follow metrics that relate to those areas.

……Data Overload
Is the information useful?
Only track data you will actually use, allowing you to see trends. Tracking extraneous data “just because you can,” takes away the focus of your metrics.
Will you have staff enter the data? It has been found that asking Users to enter data they don’t find valuable could harm User Adoption rates. However, allowing Users to see trends in their processes could motivate them to capitalize on areas where they excel. Showing Users how their data entry efforts positively impact the company’s bottom line shows them the result of their efforts.
What are you doing right?
Following the habits of your top performers is invaluable. Knowing which types of campaigns outperform others gives a focus for marketing time and dollars. Customer retention rates tied to staff activities helps define needed characteristics at hiring time.
What are your areas of opportunity?
Knowing your pipeline drop rate or un-subscription rate can help refine your marketing and sales efforts.
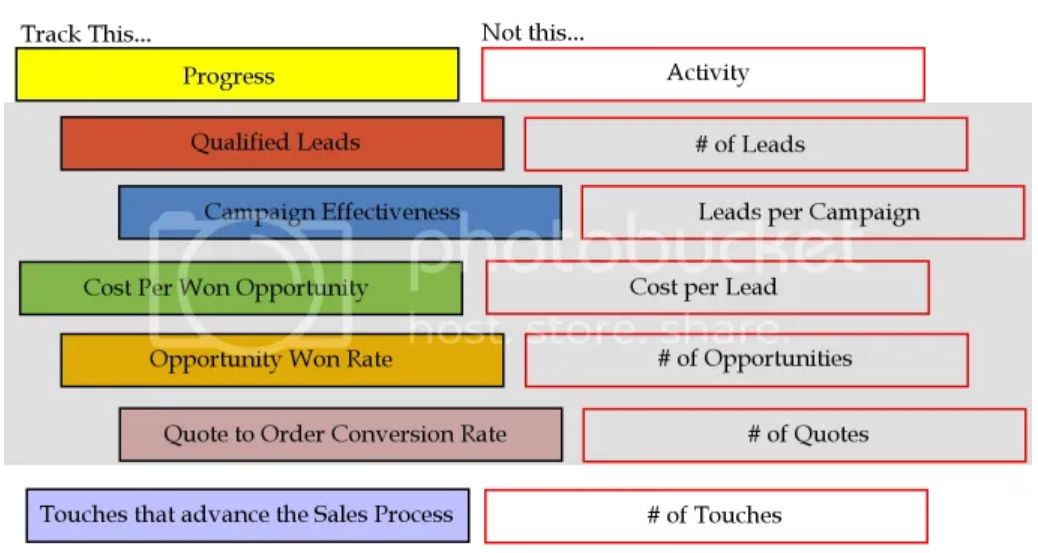
Are you tracking activity, instead of progress? Tracking reasons for lost Opportunities and Customers can help focus your future efforts in a more positive direction.
Defining your needs
If I could figure out……, then I could……… Determine the metric that will give you the answers.
Go the extra mile
Track Potential Flight Risk: How often does a specific client register complaints, call for support, request contract or obligation information, or ask how to close their account? These are all indicators that can give you a heads-up when a client is considering leaving you for a competitor.
If you track the number of touches with Potential Flight Risk Accounts, you can make sure you’re giving them excellent customer service, and possibly offer services they didn’t know about previously.
Can you do more?
A lead asks for a service you don’t provide. Track requests for that service. Perform a survey to gauge potential demand. If this is a complement to services you already provide, consider branching out.
We are tempted to track anything that will give us big numbers, and show immediate progress. Tracking the sheer number of leads added to the system will certainly give you fast results, as your sales people will download as many leads as they can find and add them. However, if you focus your efforts to measuring Qualified Leads instead, your sales people will focus on leads that have a chance of becoming sales, and work on quality in addition to quantity.
The same is true for all the other metrics here.
Top 5 Metrics for the Service Industry
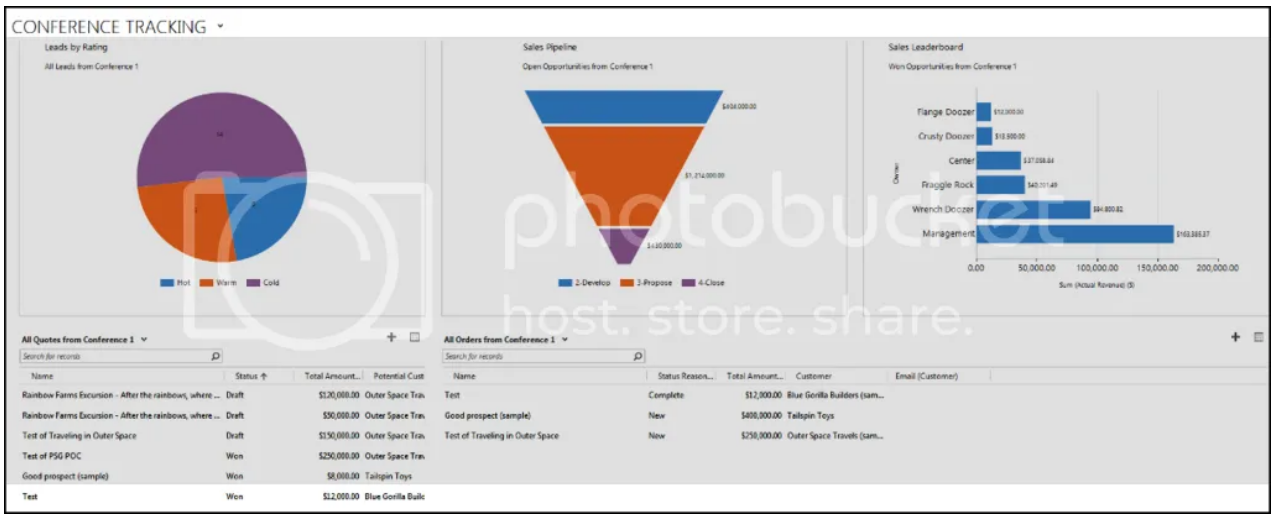
Conference Tracking
Case Tracking
Project Tracking
Relationship Refreshers
Collections


Sample KPI’s
Sales
Marketing
Service
Implementations