The Chart of Accounts Offers Full Accounting Report Benefits
In terms of streamlined and effective reporting, nothing plays a more vital role than a properly defined and organized chart of accounts.
In terms of streamlined and effective reporting, nothing plays a more vital role than a properly defined and organized chart of accounts.
Table of Content
A lot of new ERP implementations come about due to financial reporting issues. More often than not, financial reporting difficulties can be traced to a Chart of Accounts (COA) which no longer meets the company’s needs.
This situation results from the following:
Companies operating on an older or entry level ERP may not have the capability to effectively address COA related reporting issues. As a workaround, they download Trial Balances into a spreadsheet and manually re-organize the data to meet reporting needs.
In my mind’s eye, this is a short-term solution. Over time, the process becomes tedious and data accuracy suffers especially when budgets, forecasts or prior year reporting are considered. Downloading information into a spreadsheet requires additional reconciliation to ensure accuracy. This results in the reporting process becoming even less efficient over time.
Many times, to resolve these issues, the only permanent solution is an ERP upgrade.
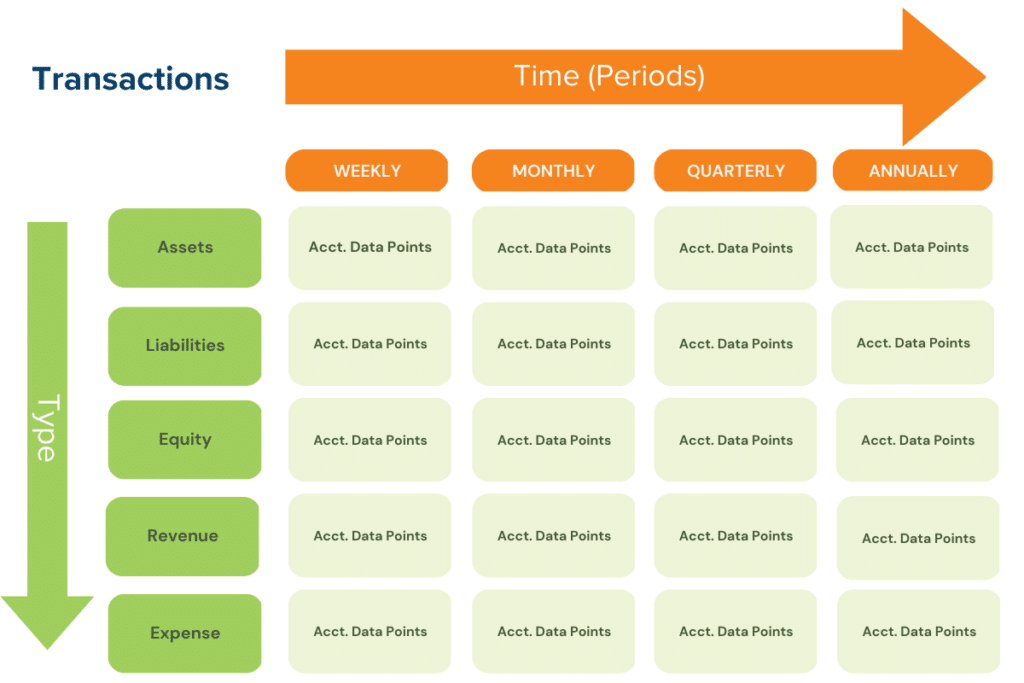
An ERP tracks financial transactions across two dimensions, Time, and Type. Transaction time dimensions are handled using the concept of accounting periods. When processing transactions, accounting periods are usually based on months. In terms of reports, reporting periods can be comprised of weeks, months, quarters, seasons, and years.
Transaction type dimensions are handled via the Chart of Accounts (COA). The COA uses GL accounts to separate transactions into general classifications such as asset, liability, equity, revenue and expense, and more detailed classifications such as salaries, rent or office supplies.
In more complex companies, the COA can also include sub-classifications such as department, product line and location. Sub-classification functionality is determined by the ERP used. Many ERPs use a single, multi-segmented account code structure.
ERP reporting tools use report columns to define the time dimension, and the transaction type dimension is controlled via report rows. The intersection of the time and type dimensions creates accounting data points. These data points are the foundation of all accounting reports.
The chart below illustrates this reporting concept.

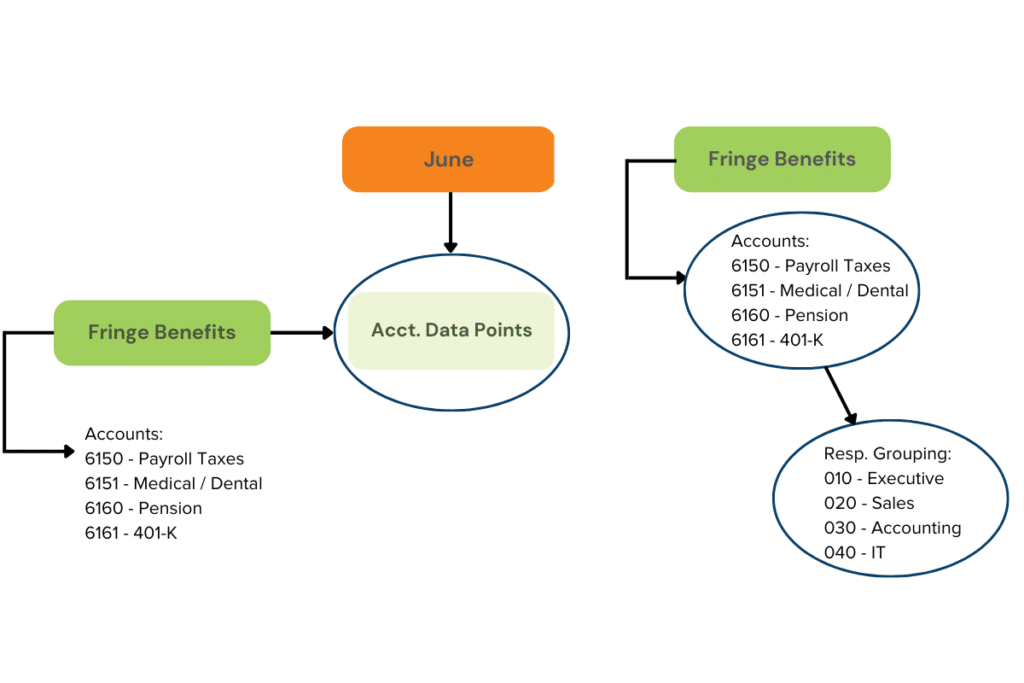
COA structures are controlled using a concept of COA account segments. The examples below relate to an account segment-based COA.
In the example here, an intersection of time and type identifies an accounting data point of total fringe benefits expense for the month of June.

Assume that total fringe benefits expense is comprised of several individual accounts:
The account number occupies the first COA segment. In this example, the first segment consists of a 4-position account number (e.g., 6150).
Each fringe benefit type can easily be viewed in the Trial Balance, as each fringe benefit type is identified by a separate account number. Since the account number sequence is straight forward and consistent, total fringe benefits are reported (in the report writer) by rolling-up the accounting report rows by the first two account values to calculate the fringe benefits total. Since all fringe benefits accounts begin with “61” this is an easy task.
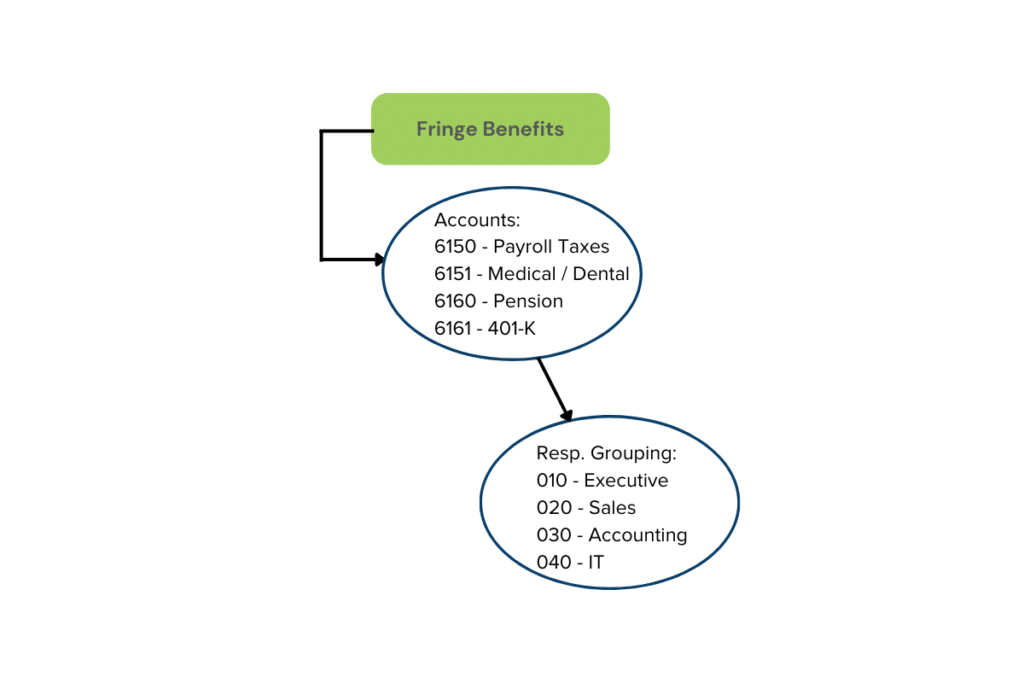
Now assume that the COA needs to be structured to group expenses by areas of responsibility such as Executive and Accounting.
In the example to the right, note the responsibility groupings. The responsibility grouping occupies a second COA segment. 
In this example, the second segment consists of a 3-position number
(e.g., 010).
Using the second segment to identify responsibility groupings would result in the following 2 segment account code for payroll taxes and medical/ dental expense in the Executive group:
Each fringe benefit / responsibility group combination is easily viewed in the Trial Balance, as each combination is identified separately. Since the responsibility group sequence is straight forward and consistently applied, fringe benefit expense reporting by responsibility group is calculated by rolling-up report rows by the responsibility group value (e.g., 010, 020).
The ability to track accounting transactions at more detailed levels such as, project or event may be required. Many ERPs today provide sub-ledger functionality. This allows the applicable details to be recorded in a single “sub-ledger”. Detailed sub-ledger categories do not utilize GL accounts. Instead, the sub-ledger detail is mapped to a limited number of GL accounts, allowing the user to keep the COA simple.
Companies with limited project accounting needs may choose to build the detail into the chart of accounts as a separate segment. This is never a good idea.
By their very nature, projects and events are temporary. Setting them up as a COA segment result in the COA becoming encumbered with numerous accounts which are no longer necessary. You might think that you can merely delete the GL accounts when they are no longer needed. Remember though, if a GL account contains a balance, ERP controls will not let you process the deletion. If you report on historical data (e.g., prior years) GL account deletion also causes problems.
Today, even the most basic ERPs provide alternatives which can be used to address this issue. In addition to sub-ledger functionality, today’s ERPs support the need to capture additional detail by using fields which are not a COA component but can be used to capture additional detail when processing transactions. The benefit of using this approach is that the COA itself is no longer burdened with an excessive number of GL accounts, yet the additional detail collected can be used in reporting.
While the fields are not attached to the COA, they are available to the report writer as search, sort and select options. Depending on the ERP, these fields are called by several names including classes, user fields or dimensions.
The advent of ERP dimensions functionality is very promising. To assist you in learning more about how dimensions can be used, I found some information on the Microsoft learning website. Refer to the Microsoft Dynamics post for more detailed information.
Here is a brief recap of what I found:
Some dimensions utilization examples are listed below:
In terms of streamlined and effective reporting, nothing plays a more vital role than a properly defined and organized chart of accounts.
Remember, there are two types of ERP reporting; “canned” (out of the box) and user defined reports built via the report writer.
Be sure that you understand any ERP GL account controls, such as account groups. For example, account groups are used in generating ERP “canned reports” such as the Trial Balance. Carelessness here will cause basic system reporting account classification problems down the road.
A properly organized COA allows the user to build reports, using the report writer, more efficiently. Report writers today are so advanced, and the reporting presentation formats so robust (standard report formats, tables, charts, and graphs), downloading Trial Balances into a database or spreadsheet to create the period reporting package should become a thing of the past.
Take the time upfront to build a chart of accounts that meets not only current needs but is flexible enough to handle any future reporting needs.