A Guide to Copilot in Excel: Analyze Data & Create Formulas
Unlock the power of AI in your spreadsheets. Our guide to Copilot in Excel shows you how to analyze data, create complex formulas, and visualize trends with less effort.
Table of Content
Most of us have a love–hate relationship with Excel. It’s where budgets are created, forecasts are tested, and performance is evaluated. But it’s also where hours can be lost to formula errors, cluttered data, and charts that never quite tell the full story.
This is exactly the kind of work Copilot in Excel can simplify. As a core part of the broader Microsoft 365 Copilot suite, it adds an AI partner inside Excel to help you analyze, calculate, and visualize with less effort. Instead of spending your energy on mechanics, you can focus on what really matters: making decisions and sharing insights.
In this brief guide, we’ll look at what Copilot in Excel is, highlight its most valuable features, share tips to get the most from it, and answer a few of the most common questions about it.
Copilot in Excel is Microsoft’s AI-powered assistant built directly into the Excel application. It combines large language models with your data in Microsoft 365 to help you ask questions, generate calculations, and visualize trends.
Instead of writing complex formulas or formatting data by hand, you can describe what you want to see, and Copilot does the heavy lifting. The goal is to free you up to focus on decision-making and strategy rather than mechanics.
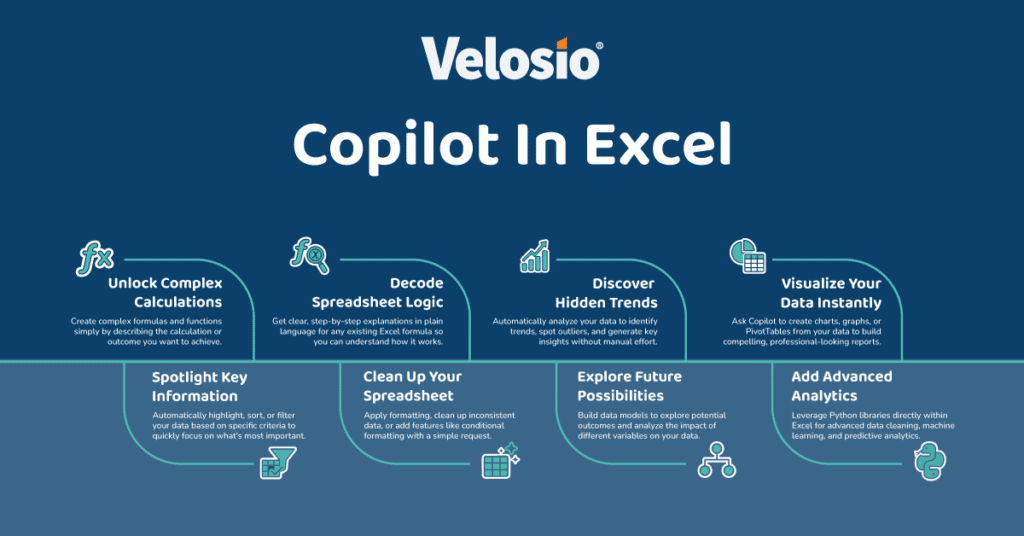
When we walk clients through Copilot in Excel, these five features stand out as the ones that save the most time and deliver the quickest benefits.
Ask Copilot questions the same way you’d ask a colleague: “Which region grew sales the fastest last quarter?” or “What are the top three drivers of cost increases?” Copilot analyzes the dataset and surfaces clear, actionable answers — without requiring you to write a single formula.
Formulas can be intimidating even for experienced Excel users. Copilot generates them based on natural language instructions, such as: “Calculate year-over-year growth for revenue in column D.” Even better, Copilot can explain how the formula works, so your team builds understanding along the way.
Clean, structured data is the foundation of good analysis. Copilot can help by formatting tables, applying filters, and sorting data with a prompt. For example, you might ask it to “organize this customer dataset by region and highlight duplicates.” What used to take hours of cleanup can now be done in minutes.
Numbers tell a story, but visuals bring that story to life. Copilot creates charts and graphs directly from your data. Whether it’s a line chart of revenue trends or a bar chart comparing expenses by department, Copilot makes it easy to turn data into visuals that clarify the point.
Planning ahead often means running what-if scenarios. Copilot can generate models and forecasts with simple prompts like, “Show me best-case, worst-case, and likely revenue for the next two quarters.” By quickly testing different assumptions, you gain a valuable perspective for making informed business decisions.
Copilot in Excel is powerful, but your results will be stronger if you follow a few best practices:
Copilot works best with well-structured tables. Take a few minutes to remove duplicates, check for missing values, and organize your data before prompting.
The more context you provide, the more accurate and useful the response will be.
Weak prompt: “Analyze my data.”
Strong prompt: “Which product line had the highest profit margin last quarter, and how did it compare to the same quarter last year?”
Copilot can highlight trends and generate forecasts, but it’s still essential to apply your expertise. Treat Copilot’s answers as the first step in your analysis, then explore deeper with your own judgment and business context.
Copilot in Excel brings intelligence into the spreadsheets you already rely on. From generating insights and formulas to modeling scenarios, it helps everyone — from finance leaders to frontline managers — make better use of data.
Velosio can help you go further. As the largest US Microsoft Business Central Partner, a Business Central Global Partner of the Year runner-up, and a 30-time Inner Circle winner, we bring unmatched expertise to help clients adopt Microsoft solutions effectively.
Explore more about Microsoft Copilot and how it connects across Word, Excel, PowerPoint, Outlook, Teams, and Copilot Chat.
Ready to see what Microsoft 365 Copilot can do in practice? Join one of our exclusive Copilot workshops and learn how to apply it directly to your team’s daily work.
We often get questions from clients who are just beginning to explore Copilot for Excel. Here are a few of the most common ones:
Yes. Copilot can reference and analyze data across multiple worksheets within a workbook. For example, you could ask it to combine regional sales from all tabs into a single summary table.
Copilot in Excel is designed to generate accurate formulas; however, errors can still occur. Always review the output — and use Copilot’s ability to explain a formula to verify its logic. Think of it as a way to save time, not as a replacement for your expertise.
Yes. Copilot operates within Microsoft 365 and respects the same security, compliance, and permissions already in place in your environment. Your data never leaves the Microsoft 365 tenant your organization controls.
Talk to us about how Velosio can help you realize business value faster with end-to-end solutions and cloud services.