Microsoft Power Platform and Dynamics 365 CRM: Understanding Analytics for the Common Data Service
Erica Ellis||
Analytics for the CDS for Microsoft Power Platform/Dynamics 365 CRM licensing provides statistics on active users, failures in system functionality & more
Table of Content
SHARE
SHARE
“If you build it, they will come” is a famous line from the movie Field of Dreams. Does the statement hold true for the Microsoft Power Platform? If you build a great system, will your employees and co-workers use it? Fortunately, you have a great tool like Analytics for the Common Data Service to help you answer that.
Analytics for the Common Data Service is functionality provided to administrators that details your organizations use of apps built on the CDS. These dashboards provide KPIs on the usage of your system including the most frequently used entities, workflows, plug-ins, and API calls. With KPIs on failures, these dashboards can also be used to ensure your system functions successfully.
Analytics for the Common Data Service is a tool included with your Power Platform/Dynamics 365 CE licensing that allows you to evaluate user adoption. It provides great statistics on active users, the actions they perform, and the areas of the system they use. It also provides information on failures in system functionality such as plugins and workflows. This tool is a replacement for the deprecated Organizational Insights (and its associated dashboard in D365 CE) formerly available through AppSource.
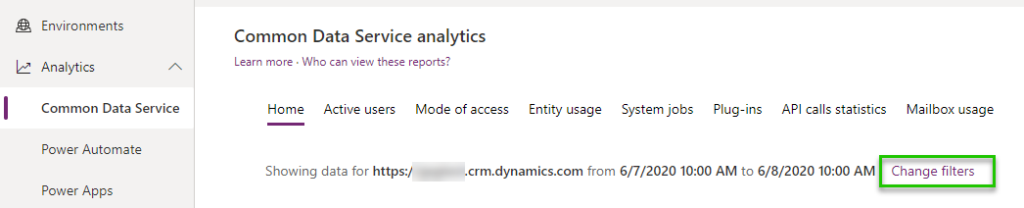
Analytics can be found at admin.powerplatform.microsoft.com and is accessible by users with the following roles: Environment Admin, Power Platform Service admin, Dynamics 365 Service admin, and Microsoft 365 Global admin. Analytics are available for all of your environments, but are typically most relevant to you in production. You can change the environment as well as the timeframe of the data you see in Analytics by changing your filter.
The Home tab summarizes Analytics with a few key charts while the other tabs offer more information on the specific area referenced in the tab name.
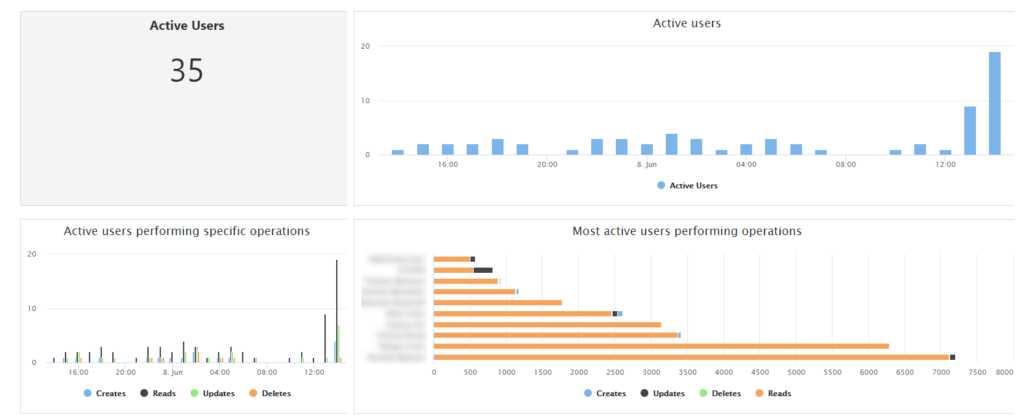
Dynamics 365 CRM Active Users Dashboard
The Active Users Dashboard provides you insight into user adoption of the system by providing statistics on the number of active users over a specific timeframe and throughout the day. Using the Analytics filter, you can change the data range to be able to understand things like the number of users who are active in the system (i.e. accessing, updating, creating, and deleting data) in the last 3 months. The default filter shows the past 24 hours leading you to see the times of day where users are more active which is great for planning system maintenance downtime. The “Most active users performing operations” chart can even help you identify your power users. With this detailed information, you can determine whether or not your users are utilizing D365 CE and what they are doing while in there.
Mode of Access Dashboard
The mode of access dashboard is an excellent tool for any system administrator trying to understand the technology used to access the system. You can see the number and portion of users accessing the system from different devices, operating systems, and browsers. In order to get exact numbers, you can hover over any area of the chart. This dashboard is not only great for planning test cases for future functionality, but it also quickly allows you to see the breadth of users effective by technology specific issues.
Entity Usage Dashboard
The entity usage dashboard shows you which entities in D365 CE and CDS are most frequently used and the actions performed on them (i.e. creates, updates, deletes, and reads). This is grouped between custom entities and out of the box entities as well.
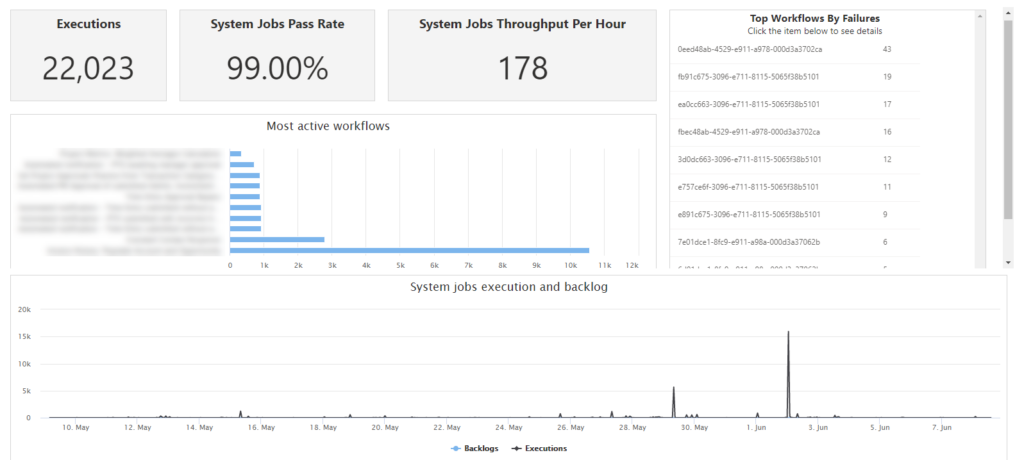
System Jobs Dashboard
System customizers and administrators can use the system jobs dashboard to see workflow execution rates and workflows that fail the most. KPIs like executions and throughput per hour provide useful information on potential system performance issues. The “Top Workflows by Failures” chart pinpoints workflows that are failing and you can even drill down to see the failure message.
Plug-ins
The plug-ins dashboard provides some similar KPIs to those on workflows. You can see the number of executions and your top 10 most active plugins. In addition, you can also see the average execution time. The plug-ins dashboard also provides the top ten plug-ins with the most failures, however it does not provide the failure message as it does with workflows. You can find that information in the plug-in trace logs in D365 CE.
API Calls Statistics
A count of total API calls during a timeframe, by day, and throughout a day can be seen on the API Calls Statistics dashboard. This dashboard also displays the most used API calls. As with workflows, this dashboard offers the top API calls by failure and drill down allows you to see the failure messages. This dashboard, along with the System Jobs and Plug-Ins dashboards, should be viewed regularly to ensure your configured and customized automation is performing properly.
Mailbox Usage Dashboard
The mailbox usage dashboard summarizes the setup of your server-side sync mailboxes. It shows you data such as the number of mailboxes for incoming email, outgoing email, and synchronization of Tasks, Appointments, and Contacts. If your business is spread across multiple worldwide locations, then this information is further grouped by geography. It will also show you the number of configuration errors that occur over the timeframe.
As a system administrator, Analytics for the Common Data Service offers a wealth of information for understanding if and where your users are adopting the system. In multiple areas, failure reporting further provides you with data to understand the functional health of your environment and helps you identify areas that may have problems. As functionality included in your existing Power Platform licensing, this tool is a must-have for your toolbox. If you need assistance in understanding CDS Analytics or resolving uncovered issues in your environment, then you can reach out to a Velosio consultant with any questions.