12 Field Service Performance Metrics Every Provider Should Track
Learn how to measure field service metrics effectively. Our expert guide provides essential tips to optimize your service operations and improve performance.
Table of Contents
Look, metrics matter. The data points you decide to track could determine whether you survive or thrive in today’s competitive field service landscape.
These numbers are your windows into operational efficiency, customer satisfaction, and overall business performance.
But — amid a sea of data and millions of potential KPIs, finding the metrics that perfectly align with your goals, answer important questions about your business, and guide strategic decisions can seem impossible.
Whether you’re new to field service metrics or think you need a fresh set of metrics, this guide will help you navigate the numbers, understand their significance, and leverage their insights toward critical goals.
Before we get into the specific metrics you should be tracking, let’s quickly answer an important question: what makes a metric worth tracking?
The thing about all metrics is, they’re both highly-subjective and extremely personal. In this post “Metrics That Matter: 5 Key KPIs for Professional Services Firms” we discuss key KPI for professional services firms.
There’s a decent amount of overlap, so might be worth a read, but the gist of it is, every organization has a different idea of what “success” should look like and how it should be measured.
Now, while metrics will inevitably vary by organization, good metrics have a some important things in common.
An excellent blog post from FieldCircle explains it like this: good metrics measure the success of your strategy. They should answer critical questions about what you’ve achieved so far, and help you understand what needs to happen next.
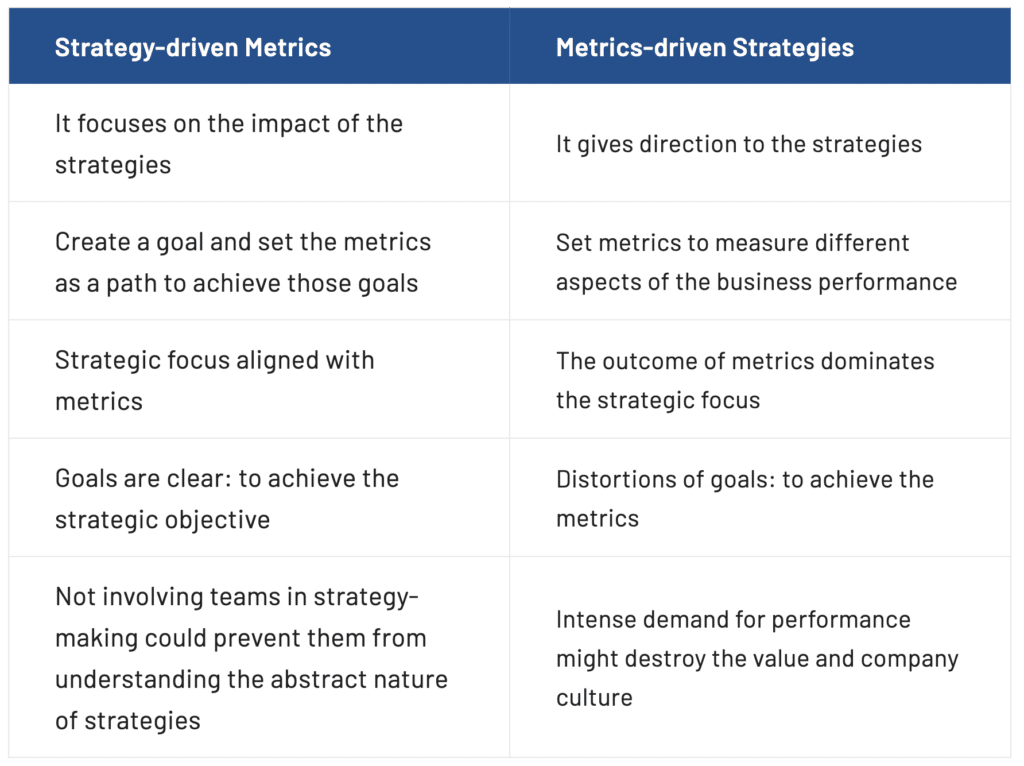
Many organizations make the mistake of building metrics-driven strategies, which tend to prioritize numbers over outcomes. It’s a subtle difference in mindset, but it makes a big difference.
For example, focusing on numbers first means you might be measuring the wrong things. It might distort goals by causing people to change their behaviors to achieve a certain benchmark.
Here’s the chart used in that blog post to further explain the difference between the two approaches:
Another point worth mentioning here is the impact technology has on field service metrics.
Obviously, legacy systems can hold you back, but, as this recent Skyllfull white paper explains, poor adoption and incorrect use of new FSM tech can prevent you not only from tracking the right KPIs – but leveraging them to drive outcomes.
All that in mind, here are some examples of field service metrics you might track to improve service experience, efficiency, and overall performance.
First-time-fix rates, or FTFRs, measure the percentage of issues that are resolved during the first visit.
High FTFRs indicate technician efficiency and competence, leading to increased customer satisfaction and reduced costs. It’s a crucial metric to track as repeat visits can drastically increase costs and lower customer satisfaction.
If field techs are struggling to solve problems the first time around, you’ll want to take a look at your support resources. Do techs have access to the information and experts they need to troubleshoot and solve common problems? Can they find that information easily, and is it available on-demand?
You might also look at existing mobile solutions. Do FSM solutions work both online and off? Can techs easily communicate and collaborate with colleagues remotely?
If not, you may need to invest in new solutions like better mobile apps and remote support tools like HoloLens 2 headsets or D365 Guides, which connect field techs to colleagues that can walk them through the repair process.
Another area you’ll want to investigate is the pre-service screening process. For example, if you already offer self-service booking, you might use an AI chatbot to ask the customer a few questions before confirming the booking.
This gives techs more information about the problem, ensuring that they bring the right tools, parts, and support resources with them to perform the service.
Mean Time to Repair, MTTR, measures the average time it takes to repair an issue after it’s been reported.
Lower MTTRs indicate greater service efficiency and less downtime for customers, which, naturally, has a significant impact on customer satisfaction, retention, and profitability.
Like FTFRs, this metric can be improved by focusing on areas like remote support, mobility, knowledge management, and AI-driven screening and troubleshooting. This time, however, the focus is on making sure techs have what they need to quickly get down to business and solve the problem.
If customer assets are IoT-enabled, you might incorporate AI troubleshooting into the booking process. This can help techs pinpoint the exact problem (and solution) before arriving on-site. In some cases, they might even be able to fix the problem remotely, eliminating the need for service altogether.
Technician utilization rate measures what percentage of a tech’s working hours are spent on billable tasks. This helps you understand how effectively resources are being used – or not – and gives you a starting point for figuring out how to improve utilization.
At a basic level, higher utilization rates indicate “better productivity,” but it’s important to make sure that you strike the right balance to prevent techs from burning out.
Tracking how much time techs spend traveling each day can give you a better sense of how they’re spending their time out in the field.
Excessive travel times often indicate there’s something wrong with scheduling and route planning processes. You might be wasting money on fuel or technician overtime, because techs are retracing their steps or spending too many hours on the road rather than using that time to serve more customers.
You might remedy these issues by embedding GPS technology into existing field service solutions to gain a deeper understanding of how traffic patterns or weather conditions impact arrival times. You might also leverage AI-driven solutions to improve route planning – helping dispatchers better manage routes by territory or find the shortest, most cost-effective routes for techs.
Another critical FSM metric you’ll want to track is how long it takes, on average, for techs to arrive on-site. If field techs are struggling to show up on time, it frustrates customers and increases churn.
This metric tracks how often technicians arrive within the agreed-upon service window. Consistently high on-time arrival rates can greatly improve customer satisfaction and trust.
Improving on-time arrival rates looks a lot like improving travel times – so, it’s going to be about looking at scheduling, dispatching, and routing processes and identifying areas where you might leverage technology to get better results.
The big difference here is that you’re focusing on these issues from a customer perspective, rather than a financial or operational point of view. So, you might analyze on-time arrivals against satisfaction rates, contract renewals, or sentiment.
Customer Satisfaction, or CSAT, scores are a direct measure of how satisfied customers are with your service overall. Regularly monitoring this metric – and how it changes over time – can help you understand your service experience from your customers’ perspective and surface opportunities for improvement.
Keep in mind, though, CSAT scores are useful if you’re in the habit of collecting feedback on a regular basis.
For example, if you’ve served a customer six times within the last year, and ask them to provide feedback for all six of those services, they probably won’t give you much to work with.
They might remember some general things about those services in the aggregate, but it’s going to be hard for them to recall specific details that might have been used to really elevate the overall experience.
Instead, you’ll want to make sure that you develop a strategy for capturing, analyzing, and implementing feedback on a routine basis. That will help you build a strong foundation for increasing CSAT scores by driving focused improvements across multiple dimensions.
Keeping an eye on call volume – and how it changes over time – can help you understand and improve overall service efficiency, as well as boost CSAT scores by ensuring that customers always receive accurate ETAs for each call.
Now, on its own, call volume won’t tell you much about where techs might be having problems. But, it’s a good jumping off point you can use to kick off your investigation.
For example, a decrease in call volume might point toward higher FTFR or MTTR rates, while a spike in call volume might suggest that techs need additional training or support. But – increases might also be a direct result of business growth (more customers = more calls).
If that’s the case, you might focus on improving this KPI by investing in better self-service solutions so that customers can book calls on their own. You might also set up automated notifications so that customers don’t need to call in order to check the status of a service.
This measures the percentage of service contracts that are renewed when they expire. A high renewal rate often indicates a high level of customer satisfaction and loyalty.
Service level agreements (SLA) define the performance standards and expectations documented in each contract.
This metric measures the percentage of services delivered as per the agreed-upon terms in each customer SLA. Higher compliance rates indicate that you’re on the right track for increased satisfaction scores, more renewals, and better retention rates.
Measuring SLA compliance can also help you improve service efficiency and overall business performance. For example, ensuring that all services are delivered in compliance with customer SLAs can prevent you from performing out-of-scope work, issuing discounts and credits, or re-doing services for free to keep customers happy.
Cost per Service Call calculates the total cost of performing each service: labor, parts, travel – the whole picture.
By keeping an eye on this metric, you can identify areas where costs can be reduced, thus improving profitability.
Again, this is a jumping off point for further investigation. Tracking this metric can help you narrow your search as you look for opportunities to cut costs or boost efficiency.
For example, you might look for opportunities to optimize service costs by redesigning processes, streamlining back-office operations, or investing in tech that better supports technicians in the field.
Revenue leakage measures the potential revenue lost because of things like process inefficiencies like unpaid invoices, unwarranted discounts, or poorly managed resources.
As you might expect, anything you can do to reduce revenue leakage can significantly improve your bottom line. Ultimately, you’ll want to look for things like timesheet errors, out of scope work, billing disputes, and undocumented processes to overcome these issues.
Tracking inventory usage rates can give you a clear picture of how often parts are used in service jobs. This metric can be used to optimize inventory management processes, reduce costs, and improve procurement and demand planning capabilities.
Tracking the right metrics allows you to ID strengths, spot inefficiencies, and make data-driven decisions to optimize operations, enhance customer satisfaction, and fuel growth.
Each of the field service metrics included above can provide valuable insights you can use to improve various aspects of your field service organization. But – you may want to track additional KPIs or swap out a few of the options we used here.
Again, metrics are unique to the org that’s tracking them – and it’s important to take the time to make sure you choose the right ones. According to Jason Wietharn, Velosio’s D365 CE Practice Director, “FSM is very process and KPI driven. Most customers do not know what KPIs but something Velosio team and help with.”
Contact us today to learn more about Velosio’s field service practice and how our experts can help with solutions, KPIs, and more.
Talk to us about how Velosio can help you realize business value faster with end-to-end solutions and cloud services.