Transform Your Data into Organizational Wealth
Uncover the secrets of transforming your data to creating effective reports and dashboards, as well as slicing and dicing data using your favorite analytical tools.
Uncover the secrets of transforming your data to creating effective reports and dashboards, as well as slicing and dicing data using your favorite analytical tools.
In a recent session hosted by Velosio, Aaron Moon, a manager on the Data Platform Services team, emphasized the value of data, stating, “Data is not just numbers; it’s the lifeblood of our decision-making process.” He went on to introduce the mission of his team, saying, “Our goal at Velosio is to help clients see data not just as numbers but as a strategic asset.”
Aaron explores the concept of Enterprise Data Fabric, with a focus on centralized business logic, optimized performance, attribute-driven security, and business-readable measures and dimensions. Uncover the secrets to creating effective reports and dashboards, as well as mastering the art of slicing and dicing data using your favorite analytical tools.
Highlighting the challenges many organizations face, Aaron remarked, “In today’s digital age, while we have more data than ever, the real challenge is making sense of it.” He further elaborated on the scattered nature of data, noting, “We often find ourselves chasing elusive facts because our data is spread across so many systems.” This dispersion leads to a delay in data compilation, and as Aaron pointed out, “Decisions based on outdated information are not just inefficient; they can be costly.”
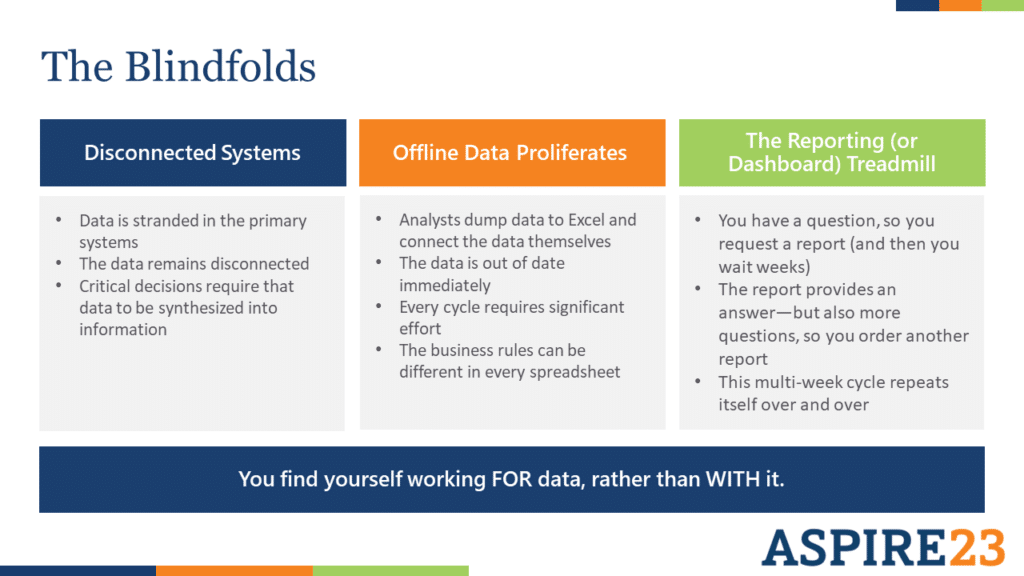
Discussing the pitfalls of current reporting systems, Aaron shared his observation: “It’s like trying to piece together a puzzle where each piece comes from a different box.” He emphasized the inefficiency of the traditional reporting cycle, saying, “We ask, we wait, we question, and then we wait some more. It’s a cycle that’s not conducive to agile decision-making.”
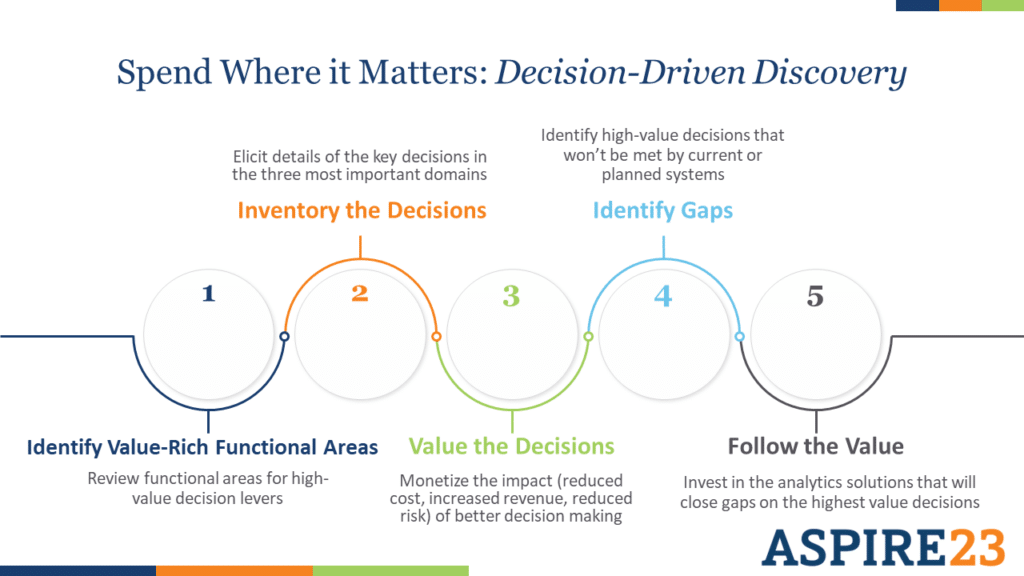
When deciding where to spend your money Velosio takes a structured approach. The first step is to identify the value rich areas that contain your most important decisions. We then inventory and translate decisions into a dollar impact. Next is to pair that up to the gaps you may have in your data that could support those decisions and finally, follow the value to your highest priority unsupported decisions.
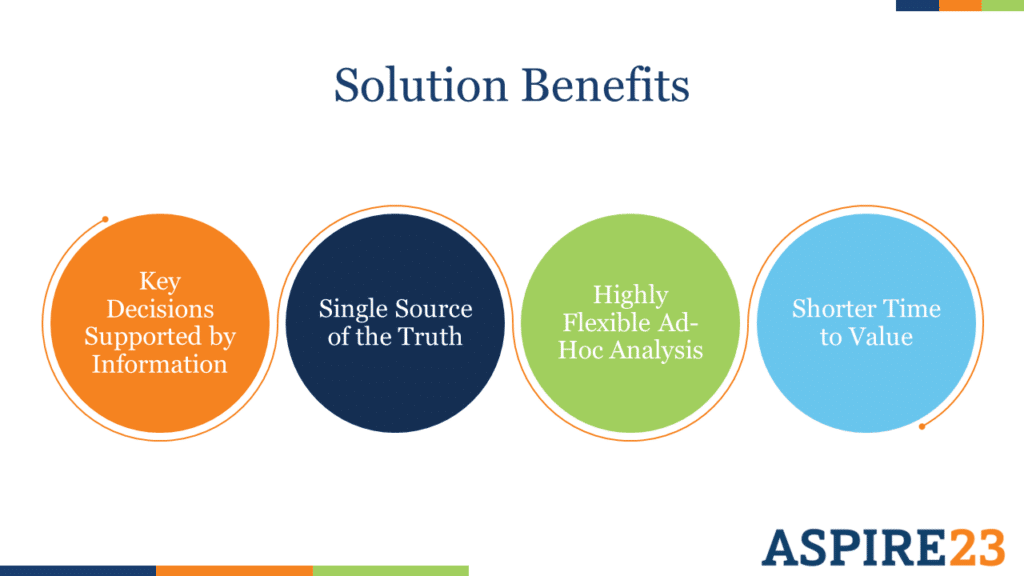
“It’s not about using data everywhere, but about using it where it can make the most difference,” Aaron advised. Prioritizing high-impact areas ensures the best return on investment.
Discussing the journey towards a robust reporting environment, Aaron explained, “It starts with ingesting, but the magic happens when we model.” He introduced the concept of a tabular model as a game-changer, saying, “A tabular model is like giving your data a GPS. It not only tells you where everything is but also the best way to get there.”
There are many types of solutions that can provide value. The first step in a solution of this kind is ingesting data from transactional systems and third parties. This lands the data in a single place, often the data is raw – however it comes from the data source. What a lot of our customers do right now create integrations directly in the reports that they create, perhaps with a tool like Power BI.
Power BI also offers builds for business rules and security directly in the reports. This can be very useful and allows them to get to the data and produce a report quickly. However, there are some challenges with this approach, without a centralized integration/tabular model, you will have inconsistencies across the reporting environment because the integrations and rules are built within the reporting layer.
This also means that building a new report is a technical task that requires IT or paying consultants to build new reports.
Suggested then, is to build a tabular model. If you are familiar with OLAP Cubes of the past, this is a very similar multi-dimensional structure that allows you to slice and dice the data. Some of the key attributes of the TM (tabular model) is centralization of the business logic at the data layer, optimized performance and security, and most importantly you have business readable measures and dimensions that allow you to slice and dice. Once that model is built then you can create reports and dashboards in a tool like Power BI or make that data with the analysts’ favorite tools.
Jeff Hoffman, a consultant at Velosio, provides a real-world demonstration of the Power BI Sales Dashboard.
Jeff’s walkthrough gives you an idea of two things:
Stop flying blind and make better data-driven decisions by ingesting data from transaction systems and third-party feeds. Unlock the true potential of your data and propel your organization towards sustained success.
Reach out to Velosio and we can evaluate and discuss the current state of your data. Everyone is in a different place on this journey towards an analytics environment you can leverage for your business. We can help you identify where the high value opportunities live and dive right into charting your path towards designing and implementing the environment that you need.