NetSuite SuiteAnalytics Tools You Should be Using
NetSuite SuiteAnalytics business intelligence toolset is a powerful tool. Use it for better reporting and smarter business decisions.
NetSuite SuiteAnalytics business intelligence toolset is a powerful tool. Use it for better reporting and smarter business decisions.
Table of Content
It’s hard to believe NetSuite was founded 20 years ago! After all, they were the first cloud ERP and the first cloud application. Not only has NetSuite proved to be one of the best financial management systems available, NetSuite has added so many features and capabilities over the years that it’s become a leading business platform for managing everything from marketing and sales to operations and e-commerce.
As they’ve added these capabilities, one new feature helps to bring it all together and let you see what’s really going on within your business is SuiteAnalytics. This business intelligence toolset was introduced in 2018.1 and has been greatly enhanced in 2018.2 and both 2019 releases. Here’s a taste of NetSuite SuiteAnalytics and why it’s a tool you should be using more and more within your business (and fewer and fewer manual, outdated spreadsheets!).
First, think of SuiteAnalytics as a collection of Reports, Saved Searches, KPIs and Dashboards. I’ll share an overview of each and wrap it this post by sharing its newest feature, Analytics Workbooks.


Running reports in NetSuite is a great way to retrieve and review real-time business data. The reporting capabilities can help you see details of nearly any area of your business. NetSuite has over 100 pre-built reports you can run as-is or customize to meet your particular needs.
Saved Searches are a way to save a search or query definition in NetSuite. You can also think of them as custom reports. Saved Searches are easy to create and enable you to get just the columns of data you need and filter just the data you want in the results. Highlighting features help bring
immediate visibility to information which might be critical or outside the normal ranges. Saved Searches are commonly used to build Workflows, automated and scheduled email alerts, dashboard reminders and even KPIs, which we’ll cover next.
Key performance indicators (KPI) help to breakdown results of data over time. NetSuite comes with more than 75 KPIs to provide key information such as revenue trends, sales pipeline trends, actual vs budget comparisons and even one for inventory that allows you to compare to previous periods. Custom KPIs can also be created through Saved Searches.
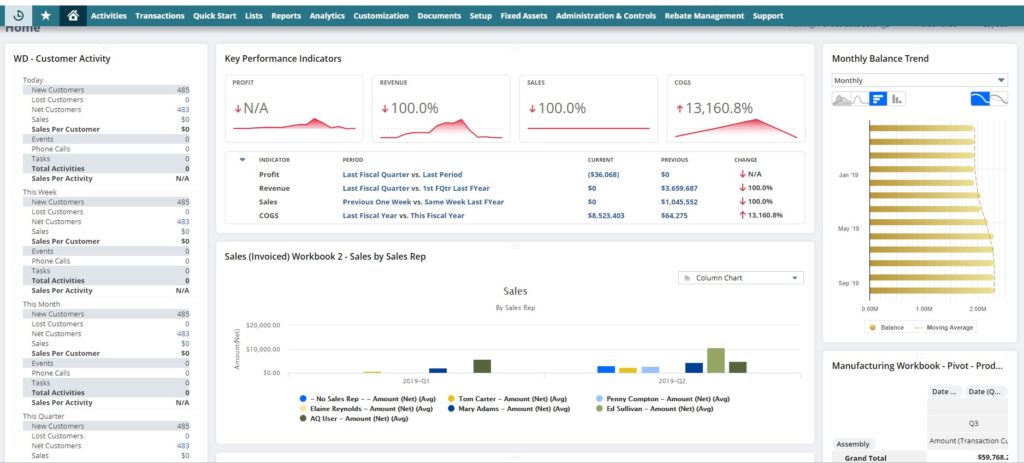
Once you have key reports, Saved Searches and KPIs built, now you can add them to a Dashboard, so you have direct, real-time access to all of your important information.
Adding items to your Dashboard is easy and is done by clicking on “Personalize” in the upper right corner when viewing your Dashboard. You can add any of the items I mentioned earlier, as well as Calendars, Quick Searches, Reminders, Tasks, Shortcuts, RSS feeds and SuiteApp components. Most of these Dashboard elements can be drilled into to show the detailed data of that element.
One of the newest features of NetSuite SuiteAnalytics is the Analytics Workbook. This was released in 2019.1 and further improved in 2019.2. Analytics Workbook gives you the ability to create spreadsheet type data sets quickly by dragging and dropping fields from within NetSuite. You can modify your saved workbooks easily at any time to add, remove or change data.
You can also create pivots of your data quickly. If you’re not familiar with pivot tables, they are ways to arrange data into a table and see relevant results based on what you have in your columns and in your rows. You can quickly see results like sales by region, sales by rep, open invoices by state, revenue by channel, employee headcount by state…nearly any comparison of any financial or operational data.
Our client was having trouble creating a report that could easily display different cases for products such as phones and laptops. They then wanted this broken up into total value, quantity on hand and quantity available for each type of case. Using the Analytics Workbook we were able to quickly and easily build out a pivot table that was able to display all the data requested and also give the client the ability to filter as they wanted.
The power of NetSuite’s analytical ability keeps getting more and more powerful. With each new update, NetSuite has been focusing on giving users access to new and better analytical tools right out of the box. Feel free to reach out to me directly if you have any questions.