Streamlining BI360 ERP Reporting Using Attributes in Your Chart of Accounts
Today we go over a neat tip for Streamlining BI360 ERP Reporting Using Attributes in Your Chart of Accounts. Learn more!
Today we go over a neat tip for Streamlining BI360 ERP Reporting Using Attributes in Your Chart of Accounts. Learn more!
Table of Content
A common trick used in BI360 with the Data Warehouse is to utilize account attributes such as parent and child to speed report execution. This is easy in the Data Warehouse since you can easily add attributes to a dimension. But did you know you can use the same methodology if you are reporting directly out of your ERP?
By taking advantage of user-defined fields in your ERP chart of accounts setup, you can add parent/child attributes to your chart of accounts and use those to streamline reporting. This will have a drastic impact on the speed of your reports by up to 70% and allow for greater reporting flexibility utilizing the attributes.
This example uses Dynamics GP, but similar logic can be applied to Dynamics SL or the native functionality built into Dynamics NAV and Dynamics AX. Feel free to reach out to our support desk for help with your specific setup!
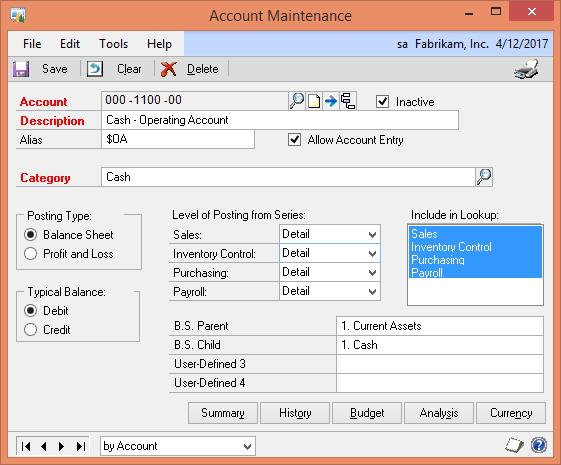
GP’s account maintenance window allows for up to four user-defined fields. Here, the first two are used for the balance sheet parent and child attributes. Each has been assigned a numbering structure corresponding to the order they should be shown on the report. For example, 1 for Current Assets, 2 for Inventory, etc. Within each parent, there is a numbering system for the children. In Current Assets, there is 1. Cash, 2. Accounts Receivable, etc.


Once the ERP chart of accounts is updated with attributes, they can use be used to write a very simple BI360 report.
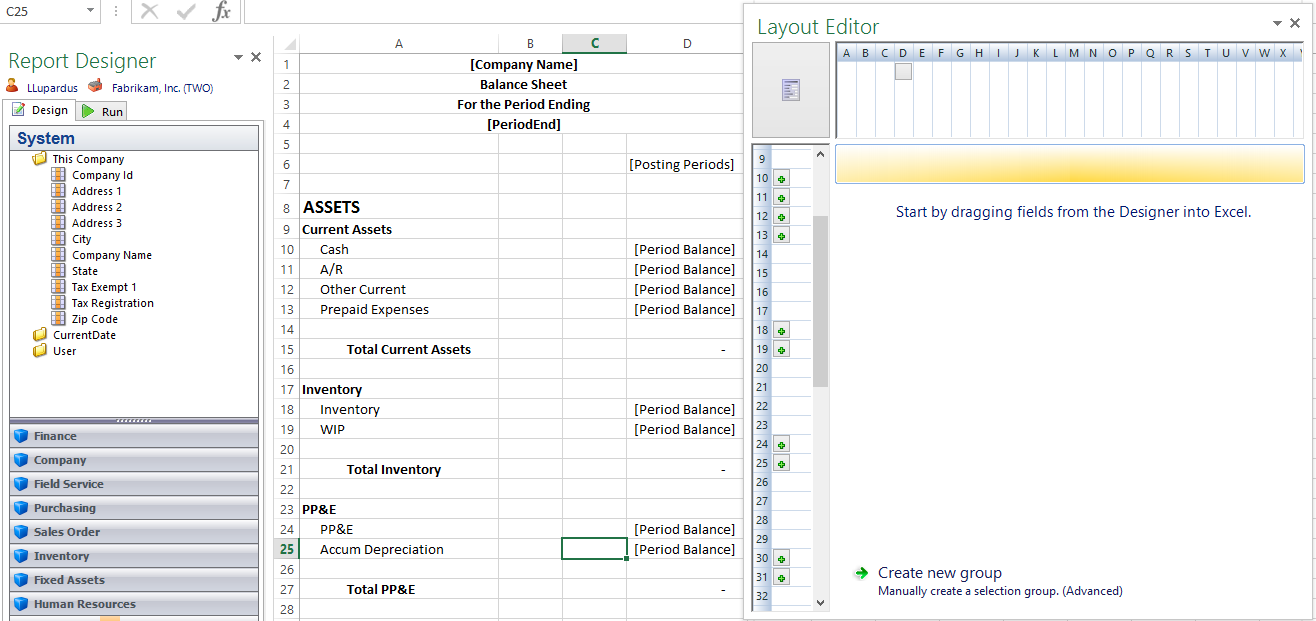
First, here is an example of a BI360 report built to replicate an FRx report, using GL accounts selected individually in the filter for each row. Notice how many filters are needed in this format, and keep in mind that each filter is a query to the database and can slow down the report.
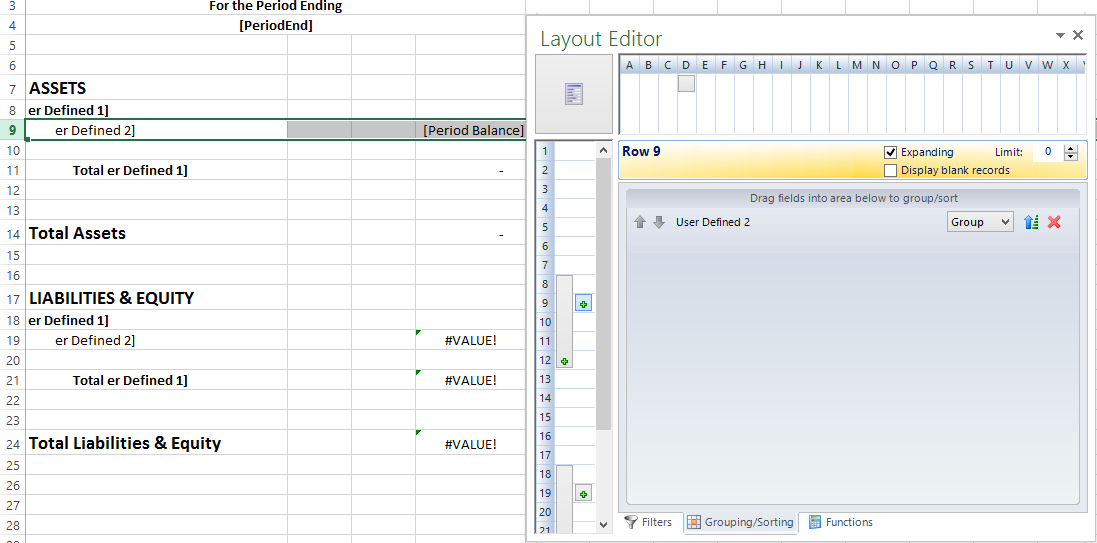
Now, here is an example of a report built with the parent/child attributes described above. Notice in this screen shot that there are only two groupings of row filters in the layout editor. These represent the assets section and the liabilities/equity section.
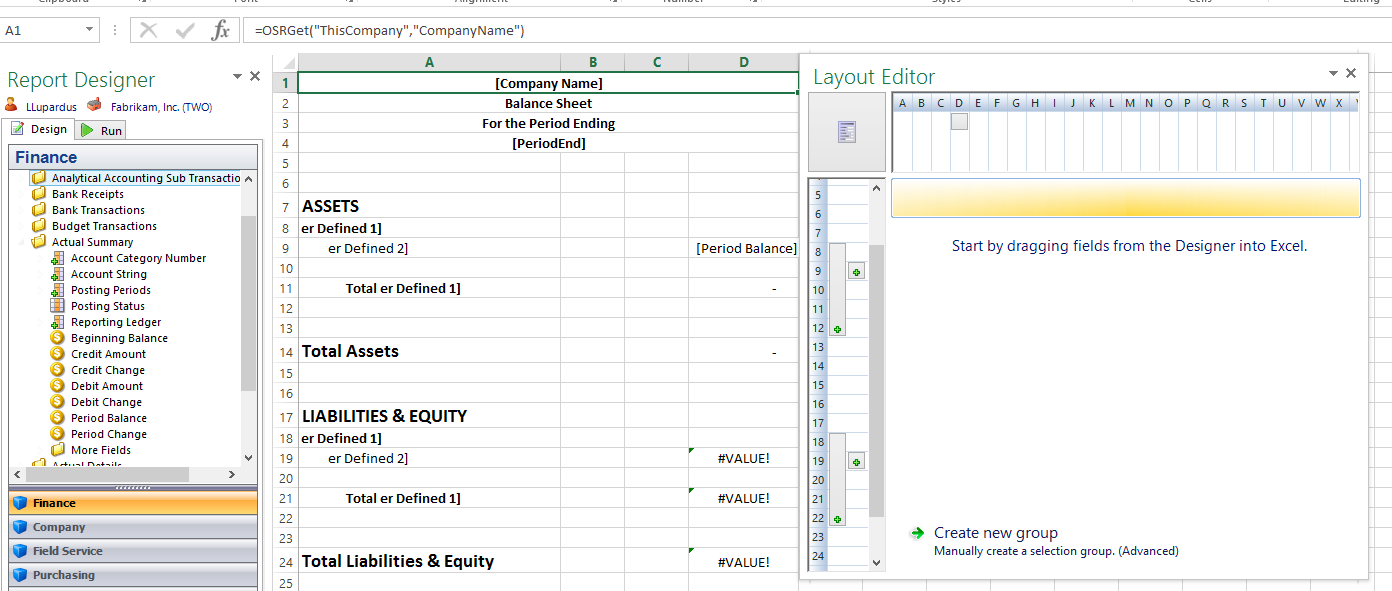
Here is a closer look at the row setup in the layout editor, to explain how the assets section will populate. Nesting groups are used to facilitate the sorting of the parents/children.
First, there is a grouping on row 9 that sorts by the User-Defined 2 (child) attribute. There are no additional filters on this row.
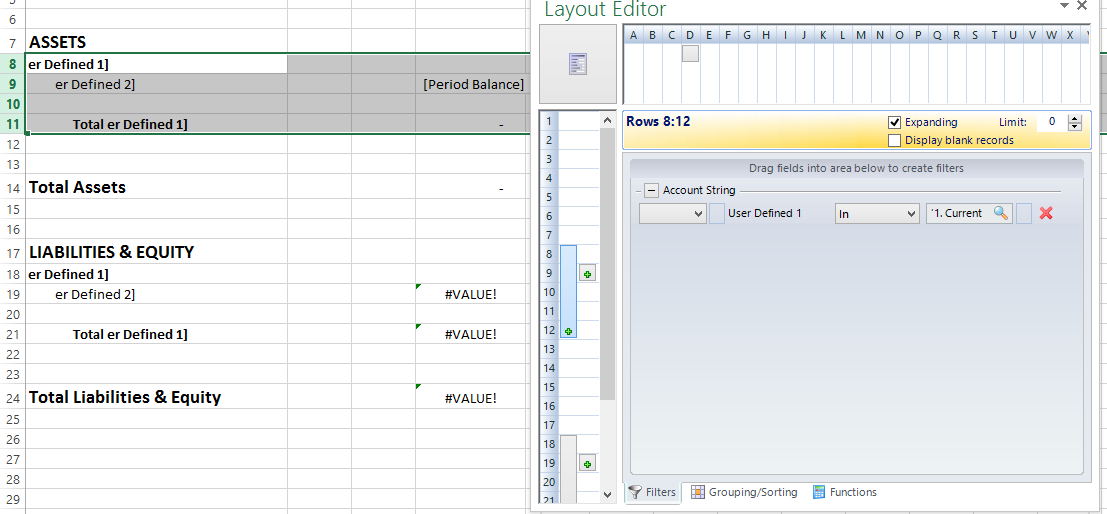
Next, there is a larger grouping on rows 8-12 that filters on the User-Defined 1 (parent) attribute. The result of this grouping is that each parent selected will be pulled into its own section of rows, with the children rolling up underneath. Because the parent filter is on the outside and includes the row with the child sorting, each parent will only include its own children. Each nested group also includes headers and subtotals, plus a blank space to delineate between the parents.
By numbering the parents/children, they can be easily sorted to appear in the correct order on the report. In order to eliminate the number from the report itself and just show the description (Current Assets instead of 1. Current Assets), the Excel function “MID” was used to display only the 4th character and beyond. The formula looks like this, with the Excel functionality highlighted: =MID(OSRGet(“GLAccountString”,”USERDEF2″),4,100)
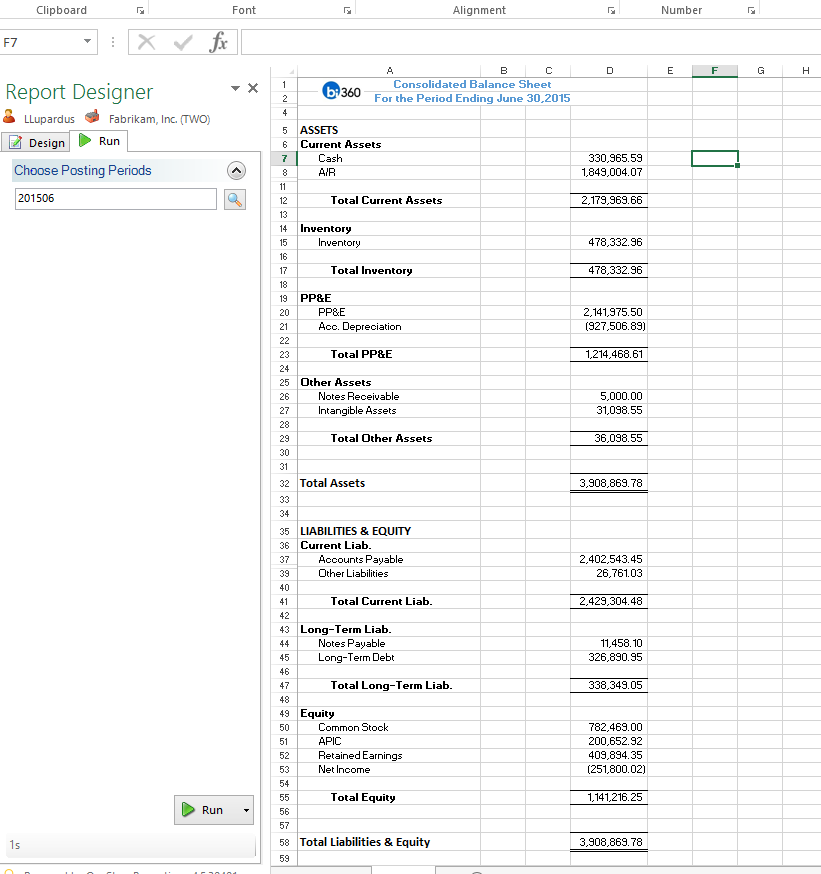
Finally, here is a generated version of the report, showing each parent with its children, including headers and subtotals: